Charts
The Charts page is where you look at Allsky data over time instead of as a single current value. It is designed for browsing trends, comparing related measurements, and building a workspace that helps you understand how your system has behaved across hours, days, or longer periods. While other parts of the WebUI are more focused on current status or individual events, the Charts page is for looking at the bigger picture.
For many users, this page becomes most useful when they need to answer questions such as:
- did a change happen suddenly or gradually?
- did two values change at the same time?
- has the same pattern happened more than once?
- was a problem limited to one short period, or was it present all night?
Charts are often the easiest way to answer those questions because they let you see changes in shape, timing, and scale much more clearly than a table or status summary can.
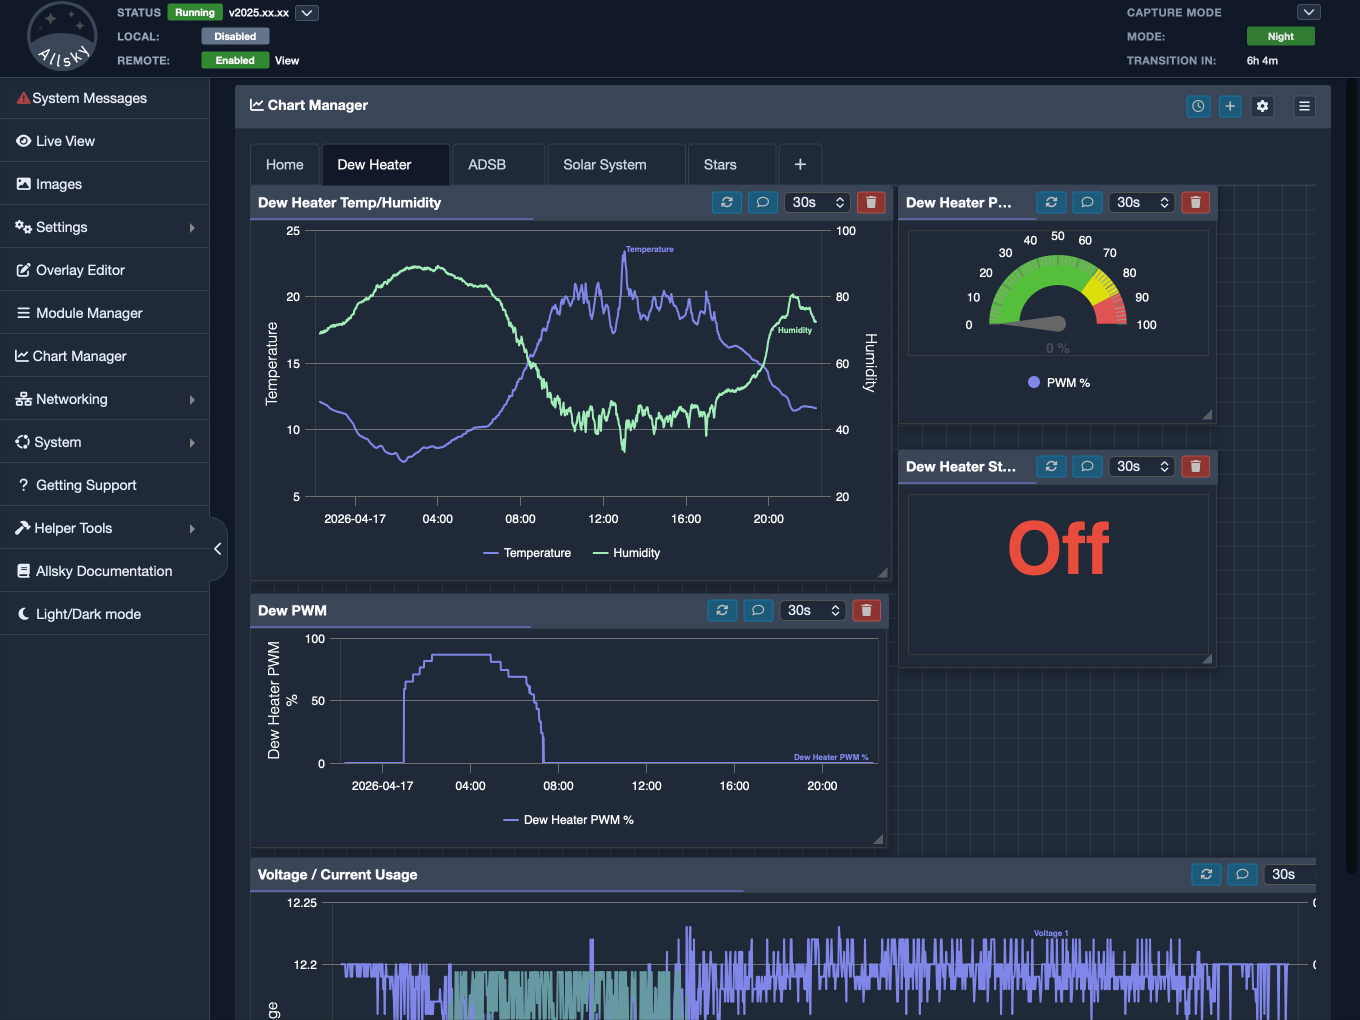
Charts page main layout
Rather than thinking of the Charts page as a single graph, it is better to think of it as a workspace. You can open different charts, organise them into tabs, resize them, move them around, and return later to find the layout still available. That makes the page flexible enough to suit very different needs. One user might create a simple layout for routine monitoring. Another might build several tabs for investigating system behaviour in more detail. Another might mainly use the page to compare a small number of important values over long periods.
Because the layout is something you can shape, the page rewards a little time spent arranging it properly. Once you have built a view that suits the way you work, the Charts page becomes much easier to use as part of your normal routine.
Think of Charts as a working area
The page is most useful when you treat it as a place to build views around your own questions. You are not limited to one fixed dashboard. Instead, you can create a layout that reflects what matters most in your own Allsky installation.
What The Page Is For
The main purpose of the Charts page is to help you understand patterns and relationships in recorded data. A single number may tell you what something is right now, but it does not show whether that value has been steady, rising, falling, or changing repeatedly. A chart adds that missing context.
This is especially useful when you are trying to interpret behaviour that develops over time. You might want to see whether conditions became worse over the course of a night, whether a change happened at the same time every evening, or whether one value appears to respond to another. In those situations, the chart view is often much easier to use than reading logs line by line or repeatedly checking current status values.
The page is also useful because it does not force you into a single fixed layout. You can keep one tab for general monitoring, another for more detailed investigation, and another for custom charts that answer a very specific question. That flexibility is important because not every user is interested in the same set of measurements or the same style of view.
Understanding The Header Controls
The controls in the top-right corner affect how you work with the Charts page. They are small, but each one serves a different purpose and is worth understanding before you start building a larger workspace.
The clock button controls the global time range for the current workspace. This is one of the most important features on the page because it allows the charts you are viewing to use the same period of time. When several charts are all showing the same range, it becomes much easier to compare them and notice whether changes line up.
In everyday use, this means you can set a period such as the last hour, last day, or last week and then see how several different values behaved over that same window. If you are investigating a known issue, you can also choose a more exact start and end time so that the charts focus on the period you care about.
The plus button opens the custom chart editor. This is used when you want to create a new chart definition of your own rather than simply place an existing chart into the page. That distinction matters. If you want to use one of the charts that already exists in the chart library, you open the chart menu and add it from there. If you want to create something new, the plus button is where you begin.
This is helpful when the built-in charts do not show the combination of information you need, or when you want a chart that is better suited to your own recurring tasks.
The gear button opens the chart manager options. These settings affect how the workspace behaves and how charts are arranged on the page. They do not change the underlying data. Instead, they help you control the layout style, grid behaviour, snapping, and default refresh settings for new charts.
These options may seem minor at first, but they can make a noticeable difference in day-to-day use. A workspace that feels tidy and easy to rearrange is much more pleasant to work with than one that always feels cluttered or awkward.
The menu button opens the available charts panel. This is where you browse the charts that are already available, including built-in charts and any custom charts you have saved. From this panel, you can choose the charts you want and add them to the current tab.
If you build your own charts over time, this panel gradually becomes your chart library. It is the central place for finding existing charts and reusing them in new layouts.
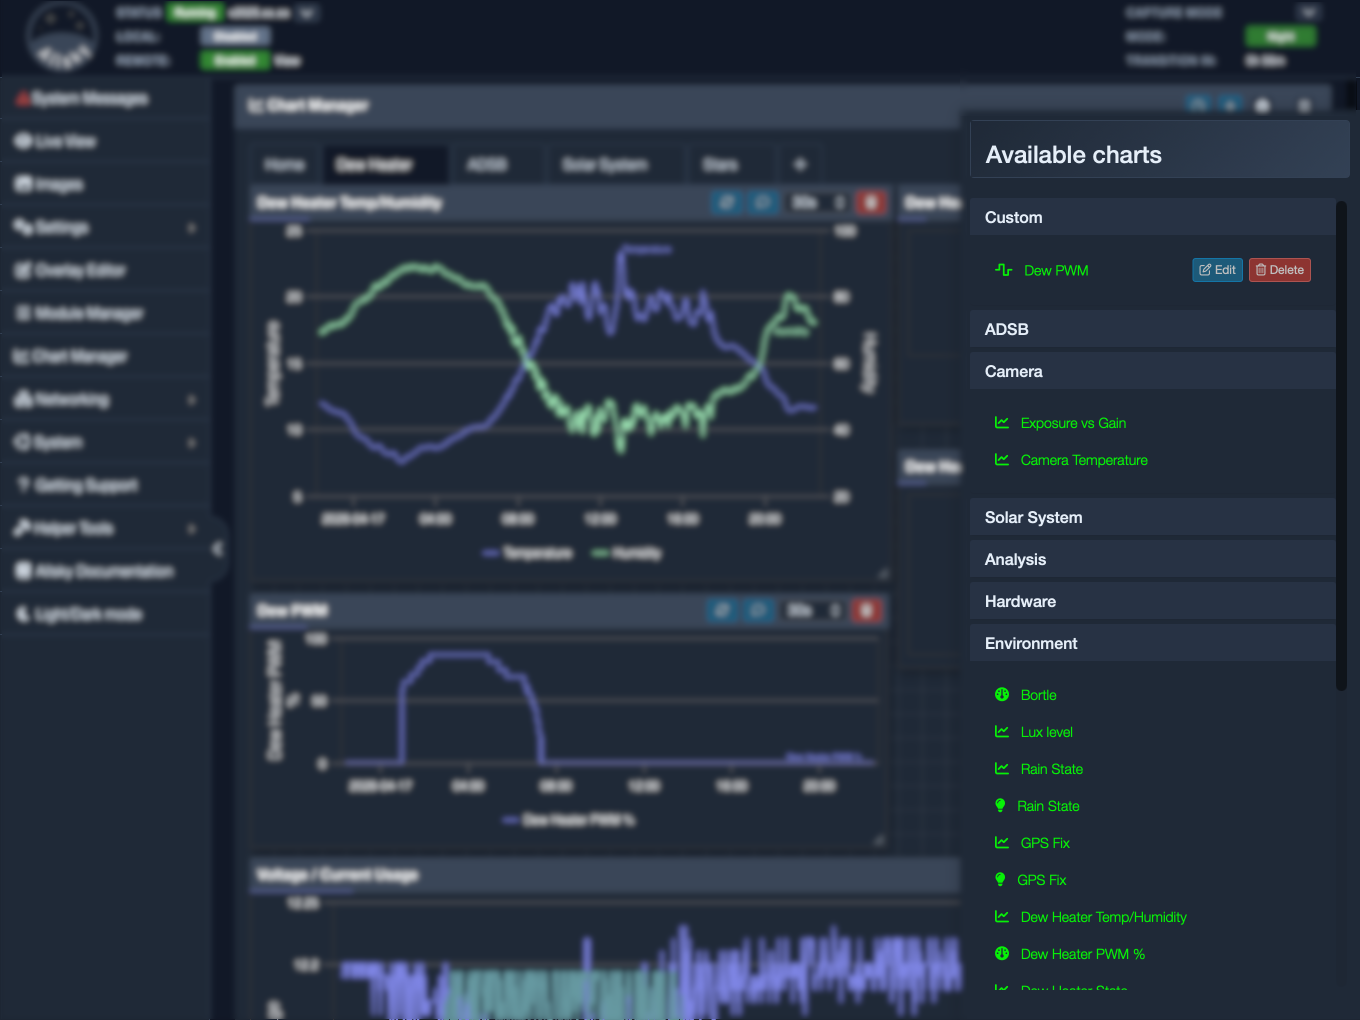
Available charts side panel
Adding A Chart To The Workspace
The normal way to add a chart to the page is through the chart menu. Open the available charts panel, choose the chart you want, and place it into the current tab. Once it has been added, it becomes part of that tab’s layout and can be moved or resized to suit the way you want to view it.
It helps to keep in mind that there are two separate ideas here:
- adding an existing chart to the workspace
- creating a completely new custom chart
These are related, but they are not the same action. Adding from the chart menu places an existing chart into your current view. Creating a custom chart defines something new that can then be saved and reused later.
Start with a small layout
If you are new to the Charts page, begin with only a few charts that answer a clear question. It is much easier to build a useful layout gradually than to fill the page immediately and then try to make sense of it afterwards.
Once a chart is on the page, you can move it and resize it. This is useful because not every chart deserves the same amount of space. Some charts are only there for context and can remain fairly small. Others may need to be larger if you want to read them carefully or compare detail over a longer period. The page is designed to support that kind of adjustment, so you should expect to refine the layout as you use it.
A practical way to build a tab
A common approach is to set the time range first, add two or three related charts, and then resize them so they can be compared comfortably at a glance. Once that works well, you can either expand the tab or create a second one for a different topic.
Working With Tabs
Tabs allow you to keep several chart layouts without forcing everything into a single crowded page. The default layout begins with a Home tab, but you can create additional tabs, switch between them, rename them, and remove them when they are no longer useful.
This is one of the features that makes the page practical for regular use. A single layout is often enough at first, but once you begin using charts more seriously, you will probably find that different tasks benefit from different views. For example, you might want:
- one tab for general system monitoring
- one tab for comparing values related to a specific issue
- one tab for experiments or less frequently used custom charts
Using tabs keeps each view more readable. Instead of building one large dashboard that becomes crowded and difficult to scan, you can keep separate workspaces with a clearer purpose.
The page also remembers the layouts you build. That matters because it means the time you spend arranging charts is not wasted. Once you have set up a useful group of tabs, they become part of your normal working environment rather than something you need to rebuild each time.
Time Range And Comparison
The shared time range is one of the features that gives the Charts page most of its practical value. When the charts in the workspace are all showing the same period, comparing them becomes much easier. You do not need to keep adjusting each graph separately just to line up the same window of time.
Quick time ranges are convenient when you want to move rapidly between common views such as the last hour, the last day, or the last week. This is useful for routine browsing and general monitoring. Start and end times are more useful when you know exactly which period you want to inspect, such as when you are investigating a particular event and want the charts to focus tightly on that interval.
The important point is that the range applies to the workspace, not just to one chart. That shared view makes it much easier to compare timing and spot relationships. If several charts all show a change at roughly the same moment, the connection is much easier to see when they are aligned to the same time window.
Note
When you change the global time range, the charts reload using that new period. If your workspace contains several charts, this may take a moment while each one refreshes. That is normal.
Auto-Refresh And Live Monitoring
Although the Charts page is excellent for reviewing past behaviour, it can also be useful for ongoing monitoring. Charts can refresh automatically, which allows the displayed data to keep updating as new values arrive. This makes the page useful in situations where you want both recent history and something close to a live view.
That balance is one of the strengths of the page. It is not just a static report, but it is also not limited to showing only the current moment. Instead, it gives you a moving window into how things have been changing.
The default refresh rate for newly added charts is controlled through the options dialog, but individual charts can keep their own settings. This is practical because some charts are more useful when they refresh frequently, while others are better left as steadier reference views.
The Options Dialog In Detail
The options dialog affects how the chart workspace behaves rather than what data is shown. These settings are mainly about making the page easier to arrange and more comfortable to use.
/// details | Grid enabled
When grid mode is enabled, the workspace shows a layout grid and charts can align to it more easily. This is helpful if you prefer a tidy, structured dashboard where charts line up neatly.
///
/// details | Grid size
The grid size controls how fine or coarse that layout grid feels. A smaller grid can give you more detailed control over placement, while a larger grid encourages broader, cleaner blocks that may be easier to manage.
///
/// details | Drag snap type
This controls how charts snap while you move them. Depending on your preference, you may find it easier to work with snapping during movement or snapping when the chart is released into place.
///
/// details | Default auto-refresh
This sets the starting refresh interval for newly added charts. It does not automatically change every chart that already exists in the workspace.
///
If the layout ever feels messy or awkward, the options dialog is a good place to check. Small changes here can make a noticeable difference to how easy the page is to organise.
Custom Charts In More Detail
Custom charts allow you to go beyond the built-in chart library and create views that are better suited to your own needs. This is useful when the available charts are close to what you want but do not quite answer the question you are asking.
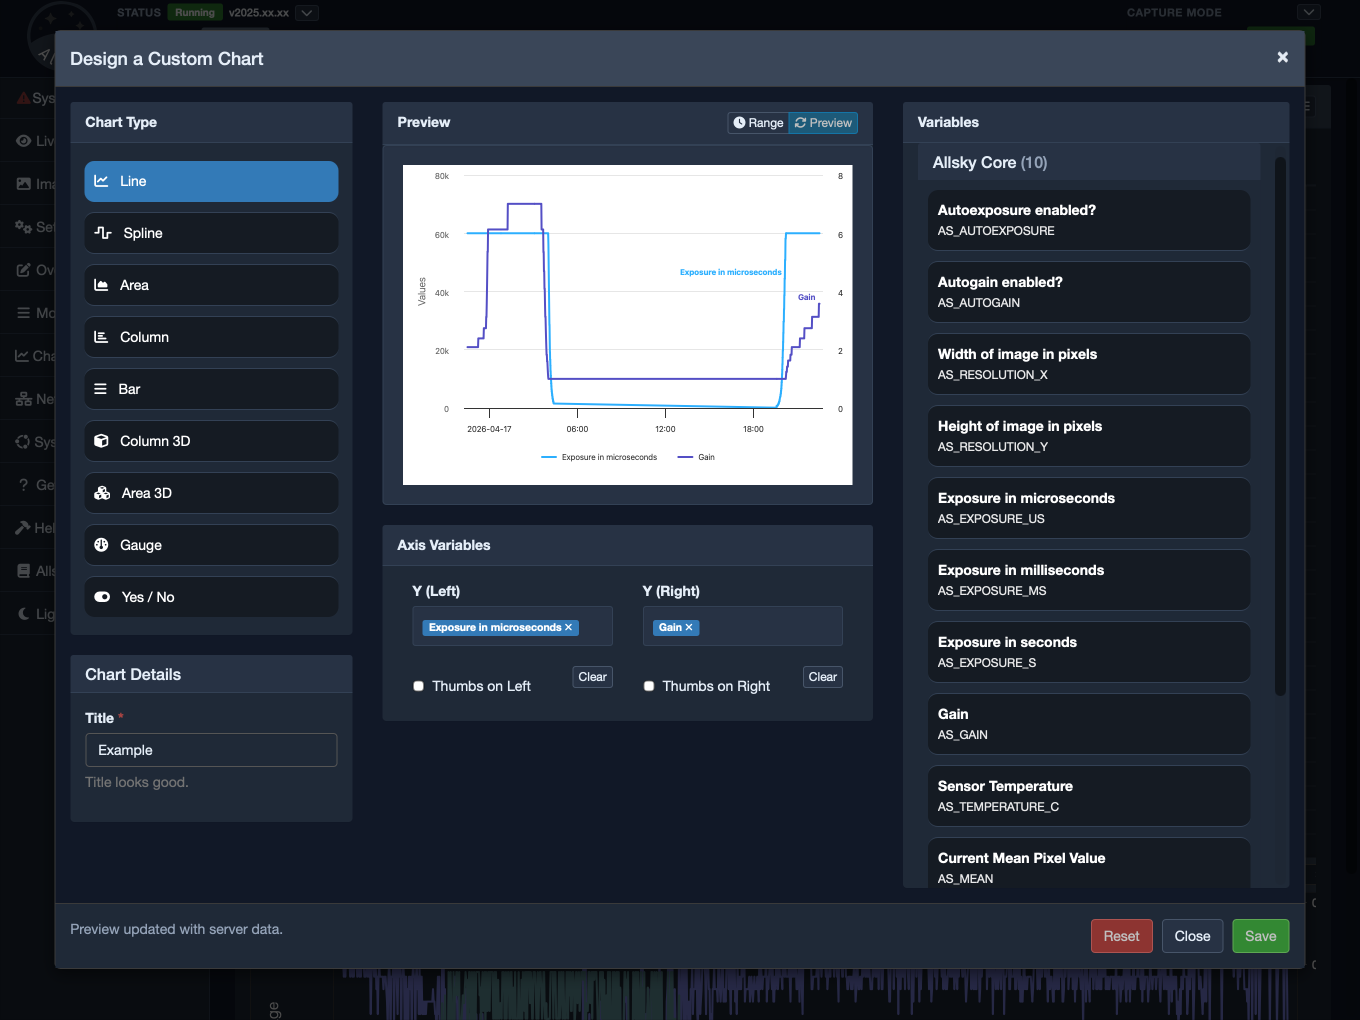
Custom chart editor
Creating a custom chart normally involves opening the editor with the plus button, choosing the settings for the chart you want, giving it a clear title, and saving it. Once saved, it becomes part of the available charts list and can then be added to a tab in the same way as any built-in chart.
This makes custom charts practical rather than temporary. You are not just creating a one-off graph for the current session. You are adding something to your chart library that can be reused whenever you need it.
Saving a custom chart does not place it on the page automatically
Saving creates or updates the chart definition in the library. You still need to add it to a tab from the chart menu when you want to use it in a layout.
When creating a custom chart, it is best to begin with a clear purpose. Think about the question you want the chart to answer. A chart that is built around one clear idea is usually much easier to read and more useful in practice than a chart that tries to include too much at once.
When should you create a custom chart?
A custom chart is usually the right choice when the data you want is available, but the existing charts do not present it in the way you need. If a built-in chart already answers the question clearly, it is usually better to use that. If it does not, a custom chart gives you a way to create a view that matches your own workflow.
Over time, a small collection of custom charts can make the Charts page much more personal and much more useful. Many users eventually build a set of favourite views that reflect the parts of their system they care about most.
Built-In And Custom Charts Together
One of the strengths of the Charts page is that built-in charts and custom charts work together in the same library and the same workspace. Once a custom chart has been saved, it behaves like the other available charts and can be added to tabs in the same way.
That means you can mix built-in and custom charts freely. A built-in chart might provide broad context, while a custom chart focuses on one specific comparison that matters to your installation. Used together, they can create a much more useful workspace than either type alone.
Making The Most Of The Page
The Charts page is most effective when you use it with a clear purpose. Instead of adding charts at random, decide what you want to compare or understand, choose an appropriate time range, and then add only the charts that help answer that question. Arrange them so the comparison is easy to read, and use separate tabs when a different topic needs its own space.
Over time, this page often becomes one of the most revealing parts of the WebUI. It does not replace logs, and it does not replace the system status pages, but it complements them by showing change over time in a form that is easy to interpret. That is what makes it so useful. It helps you see trends, compare related values, and build views that match the way you actually investigate and monitor your Allsky system.