System Status
The System tab is the main health dashboard for your Allsky installation. If you are not sure where to begin, this is usually the right page to open first. It is designed to answer the everyday questions most users have when checking on their system, such as:
- Is the Raspberry Pi up and reachable?
- Is Allsky currently running?
- Has the system been running for a long time or did it recently restart?
- Is the Pi getting too hot?
- Is the system short on disk space or memory?
- Is there an obvious problem that needs attention right now?
In other words, this page is less about detailed troubleshooting and more about quick understanding. It gives you a broad picture of the current state of both the Raspberry Pi and the Allsky software, with the most important controls close at hand in case you need to intervene.
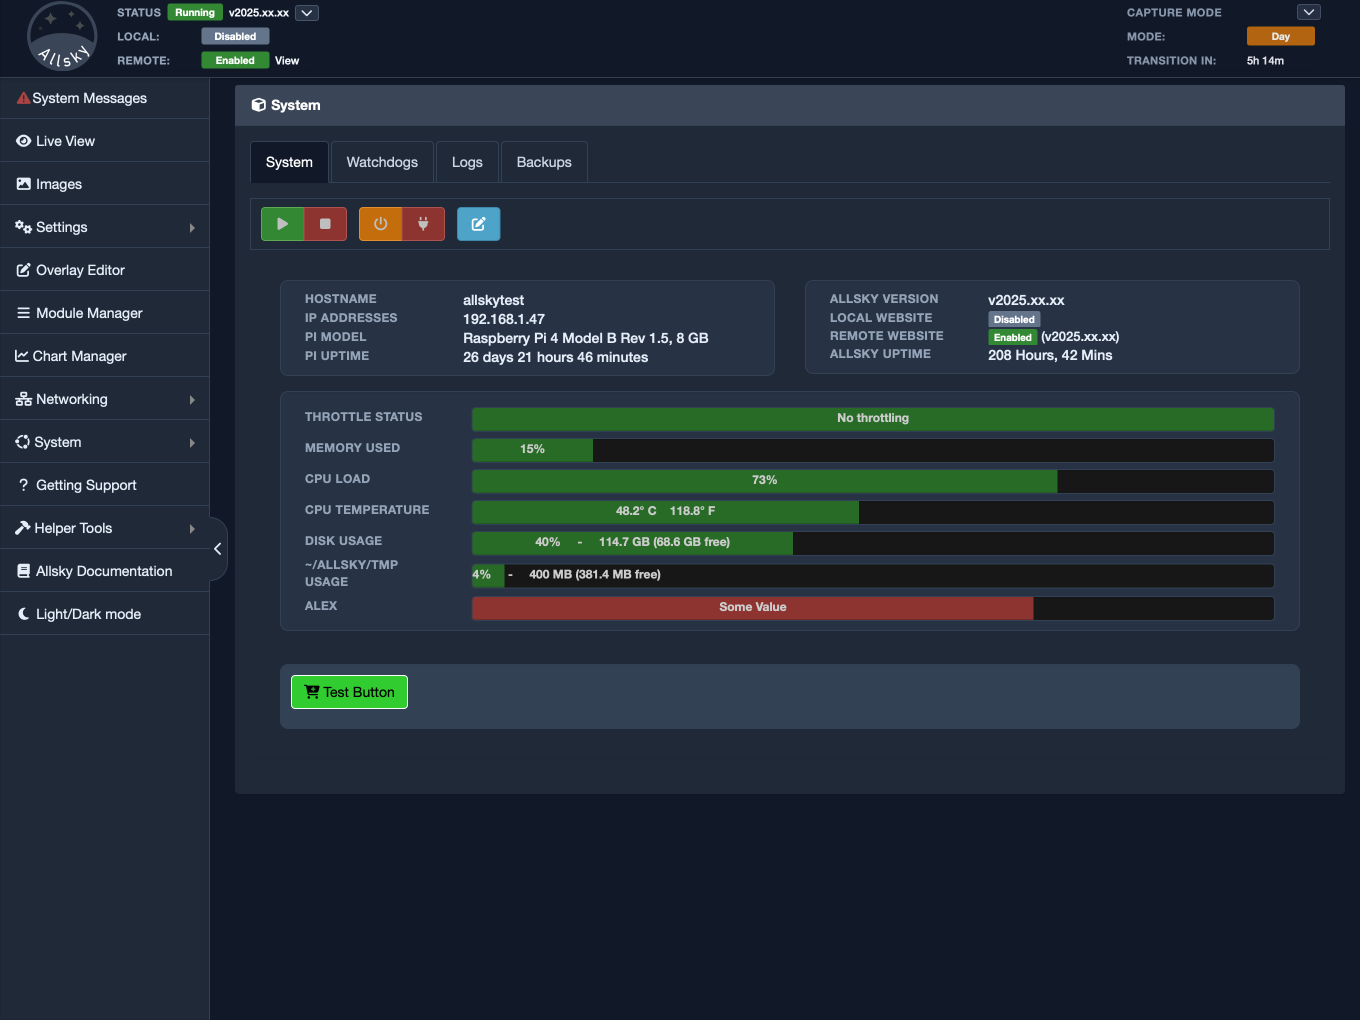
System tab overview
Why This Page Matters
When an Allsky system is behaving normally, the System tab gives you confidence that everything is healthy. When something is wrong, this page often tells you that very quickly, even before you open logs or other diagnostic pages.
For example, you might come here because:
- your website stopped updating,
- Live View seems stale,
- the Pi feels slow,
- you suspect a power or temperature issue,
- you want to restart Allsky after changing a setting,
- you want to confirm the machine has the correct IP address before connecting remotely.
The page is useful because it combines several kinds of information that are related but not identical. The Raspberry Pi itself can be healthy while Allsky is stopped. Allsky can be running while the Pi is low on disk space. The network can be fine while the CPU is overheating. Seeing all of these together makes it much easier to decide what to do next.
The Action Buttons
Near the top of the page you will see the main control buttons. These are the controls you are most likely to need during normal operation.
Depending on your installation, the page may include buttons to:
- start Allsky,
- stop Allsky,
- reboot the Raspberry Pi,
- shut down the Raspberry Pi,
- open an editor for custom System page items.
These controls make the System tab more than a passive dashboard. It is also a practical operating page. If Allsky has stopped and you simply need to bring it back up, you can usually do that here without leaving the browser. If you are about to unplug hardware or perform maintenance, this page may also be the most convenient place to shut the Pi down cleanly first.
It is worth using these buttons carefully, especially on remote systems. A reboot or shutdown may temporarily remove your web access. That is not usually a problem when the Pi is nearby, but it matters more if the system is mounted outdoors, installed at a remote site, or accessed over a less reliable network connection.
The Host Information Panel
One of the first things this page shows is basic information about the Raspberry Pi host. This section typically includes items such as:
- the hostname,
- one or more IP addresses,
- the Raspberry Pi model,
- the host uptime.
This information is simple, but it is extremely useful in day-to-day use.
The hostname helps confirm that you are connected to the correct machine. This matters more than many people expect, especially if you have more than one Pi on your network, or if you keep a spare unit for testing.
The IP address display is also important. If you connect to the WebUI by hostname most of the time, you may not think about the actual address often. But when remote access fails, when DHCP changes, or when you are configuring port forwarding or firewall rules, having the current addresses visible saves time.
The Raspberry Pi model helps confirm what hardware Allsky is running on. This can be useful when comparing performance between systems, reading support advice, or checking whether the system should reasonably be expected to handle a certain workload.
The host uptime tells you how long the Raspberry Pi itself has been running. That can answer a surprising number of questions. If you thought the system had been stable for weeks but the uptime says it rebooted recently, that is an important clue. It may indicate a power interruption, a deliberate reboot, a crash recovery, or maintenance performed by someone else.
The Allsky Information Panel
Alongside the host details, the page also shows information specifically about the Allsky software. This section usually includes:
- the installed Allsky version,
- whether the local website is enabled,
- whether the remote website is enabled,
- the Allsky uptime.
This separation between host information and Allsky information is very helpful. The Raspberry Pi and the Allsky service are connected, but they are not the same thing. A healthy Raspberry Pi does not automatically mean Allsky is running correctly, and a recently restarted Allsky service does not always mean the whole Pi restarted.
The installed version is useful when you are confirming an upgrade, comparing notes with the documentation, or preparing a support request.
The website status lines tell you whether the local and remote website features are enabled. That matters because many users first notice a problem when images stop appearing on a website. If the relevant website function is disabled, the explanation may be very simple. If it is enabled but the site still is not updating, you know to keep investigating.
The Allsky uptime is especially valuable because it tells you how long the service has been running, not just how long the computer has been powered on. If the Pi uptime is very long but the Allsky uptime is short, then Allsky has restarted at some point while the host remained up. That distinction can help you decide whether the issue is likely to be with the operating system, the service, or a configuration change that caused Allsky to restart.
Reading The Health Indicators
The lower section of the page is often the part users watch most closely. This area contains the live health indicators and resource bars. These displays are intended to help you judge the condition of the system quickly, without needing to log into the Pi and run command-line tools.
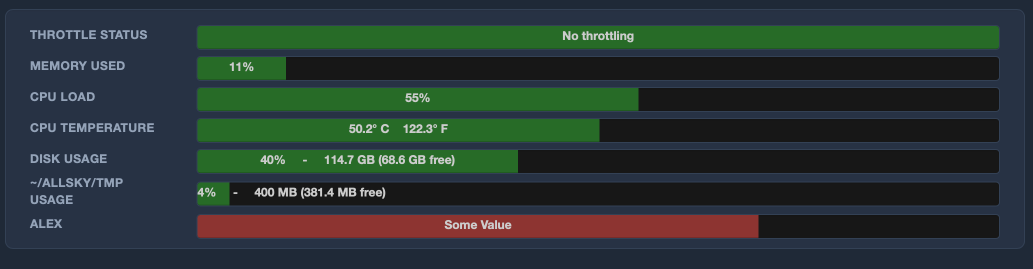
System tab resource and health indicators
The exact set of indicators can vary, but common entries include:
- throttle status,
- memory usage,
- CPU load,
- CPU temperature,
- disk usage,
- temporary storage usage.
Each of these tells you something different about the health of the system.
Throttle Status
This is one of the most important indicators on a Raspberry Pi. It can reveal power or thermal problems that might otherwise show up only as vague or inconsistent behaviour.
If the Pi reports undervoltage, thermal throttling, or related conditions, performance may be reduced and hardware may not behave reliably. Cameras, USB devices, uploads, and background services can all be affected by poor power or excessive heat.
If this field does not look healthy, treat it seriously. A throttling warning is not just an abstract technical detail. It often points to a real underlying problem such as:
- an inadequate power supply,
- excessive cable loss,
- poor ventilation,
- a fan or cooling issue,
- an enclosure that is trapping too much heat.
Memory Usage
The memory display shows how much RAM is currently in use. Short-term changes are normal, especially while the system is actively capturing, uploading, creating images, or serving WebUI requests.
What matters most is the overall pattern. If memory usage stays high for long periods and the system feels sluggish, that may indicate the Pi is under pressure. Occasional increases are usually less concerning than a system that appears to remain close to its limit all the time.
CPU Load
CPU load gives you a sense of how busy the processor currently is. A brief spike is not necessarily a problem. Many normal tasks can cause the CPU to work harder for a while, especially on smaller Pi models.
However, if the CPU load remains persistently high, and especially if that happens together with high temperature or slow performance, it may point to a system that is struggling to keep up. In that case, the System tab helps you see the symptom, while the Logs and Watchdogs pages may help you understand the cause.
CPU Temperature
Temperature is one of the most practical readings on the page. Outdoor and enclosed Allsky systems do not always have ideal airflow, and heat-related issues can be subtle at first.
If the CPU temperature is consistently high, the system may become unstable or begin throttling. Even if the system has not yet reported an obvious thermal warning, a steadily elevated temperature is worth paying attention to. It is often easier to improve cooling early than to wait for intermittent failures later.
Disk Usage
The disk usage row helps you understand how much space remains on the storage device that holds the system and its files. This is a critical metric for any system that continuously produces images, logs, and derived data.
When storage gets low, the symptoms can appear in many different ways. Captures may fail, uploads may stop, temporary files may not be created correctly, and parts of the system may behave unpredictably. Because of that, disk usage is something worth checking regularly rather than only after a problem appears.
One especially useful detail is that the page shows more than just a percentage. It also shows the total size and the remaining free space. That makes the display much easier to interpret. A value such as 80 percent used may or may not be urgent depending on the total capacity and the rate at which your system is generating data.
Temporary Storage Usage
Temporary storage is another value that can become important during normal Allsky operation. Temporary files are often created as part of processing, uploads, and web-related tasks. If temporary storage fills up, you may see failures that do not immediately look like disk-space problems unless you know where to look.
For that reason, it is worth treating temporary storage as a separate health signal rather than assuming it will always track the main disk usage in an obvious way.
Custom Items On The System Page
Your System tab may contain more than the built-in Allsky indicators shown in the examples above. Allsky allows custom additions to this page, so some installations include extra lines, progress bars, or buttons created by the user.
These custom items can be used to display site-specific information such as:
- a temperature sensor reading,
- power information,
- dew heater state,
- weather-related values,
- a maintenance or reset button,
- the output of a local monitoring script.
This flexibility is useful because every installation is a little different. A simple home setup may use only the built-in fields. A more advanced observatory or outdoor installation may add extra operational checks that are important for that environment.
If your System page contains additional items that are not mentioned in the standard documentation, that does not necessarily mean something is wrong. It may simply mean your installation has been customized.
How To Use This Page In Practice
Most users do not need to study every number on this page every day. The best way to use the System tab is as a quick operational checkpoint.
A practical routine might look like this:
- Confirm that the Raspberry Pi is up and the IP address looks correct.
- Check whether Allsky is running and whether its uptime looks sensible.
- Scan the throttle, memory, CPU, temperature, and storage indicators for anything obviously unhealthy.
- If needed, use the control buttons to start or stop Allsky, or reboot the Pi.
- If the page shows a problem but not the reason for it, move on to the Logs or Watchdogs pages for more detail.
This page is often enough to answer broad questions like:
- Is the system healthy?
- Did the Pi reboot?
- Did Allsky restart?
- Is the system overheating?
- Is storage running out?
- Is there an obvious reason the system is misbehaving?
If the answer is still unclear after checking the System page, that usually means the problem is no longer a high-level status issue and should be investigated in more detail elsewhere in the WebUI.
When To Look Somewhere Else
The System tab is an excellent summary page, but it is not meant to answer every possible diagnostic question.
You should usually move to another page when:
- you know something failed and want the exact error message,
- you need to inspect service-level state in more detail,
- you want historical trends rather than current values,
- you are troubleshooting a specific subsystem rather than the whole machine.
In those cases:
- use Logs when you need detailed evidence of what happened,
- use Watchdogs when you want to inspect monitored services,
- use Charts when you want to understand changes over time.
That relationship is important to understand. The System tab tells you whether the installation looks healthy right now. The other pages help explain why it does or does not.
System Page Additions Editor
The System page also includes a built-in editor for System Page Additions. This is the part of the page that lets you create and manage your own extra rows, progress bars, and action buttons without manually editing the additions files in a text editor.
For many users, this editor is the easiest way to customise the System page. Instead of remembering the exact file format used by additions files, you work with a form-based interface in the WebUI. You choose the kind of item you want to add, fill in the fields you care about, and save the file. The editor then writes the additions file for you in the correct format.
This makes the feature much more approachable, especially if your goal is practical rather than technical. You may simply want the System page to show a weather reading, a dew heater status line, a fan speed indicator, or a button that runs a maintenance script. In those cases, the editor is often a much more comfortable starting point than hand-building the file structure yourself.
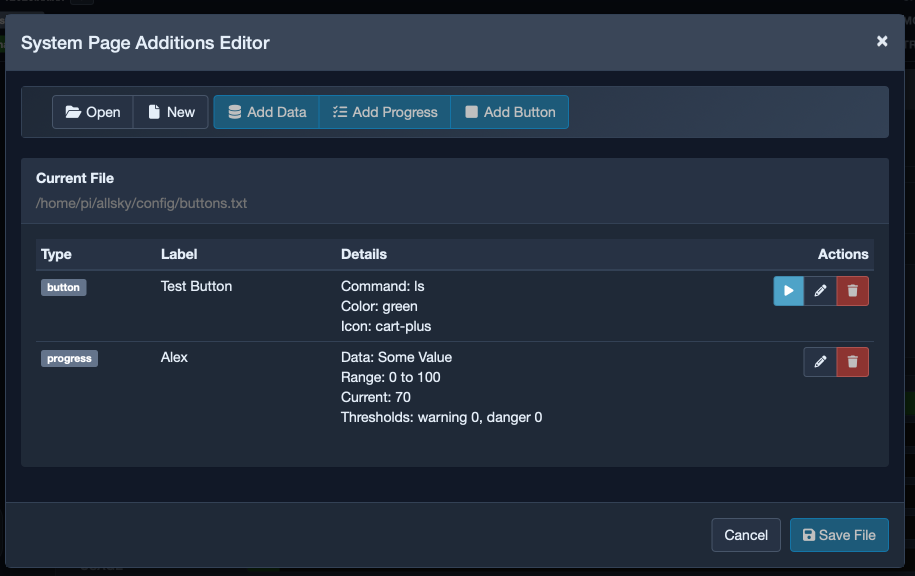
System Page Additions Editor overview
What The Editor Is For
The additions editor is used when the built-in System page information is not enough for your installation and you want to place extra information or controls alongside the normal Allsky status items.
Typical uses include:
- showing weather station data,
- displaying the state of a dew heater or fan,
- adding a progress bar for a sensor value,
- creating a button that runs a script,
- exposing site-specific operational checks on the main status page.
The important idea is that these additions are meant to make the System page more useful for your own setup. They are not limited to Allsky’s default information. If your installation has extra hardware, extra scripts, or extra monitoring that matters to you, the editor gives you a structured way to surface that information in the WebUI.
Opening The Editor
If the editor is available on your system, you open it from the System page using the button for custom System page items. The editor opens in a separate dialog window over the page.
Inside that dialog, you work with one additions file at a time. The editor can open an existing additions file, or it can create a new one for you. New files are stored in the Allsky configuration area, which helps keep them separate from the core application files and makes them easier to preserve across upgrades.
This is an important detail for everyday use. You are not expected to hunt through the filesystem looking for the right place to store these files. The editor is designed to guide you towards the supported location and to make opening, creating, and saving additions files feel like a normal WebUI task.
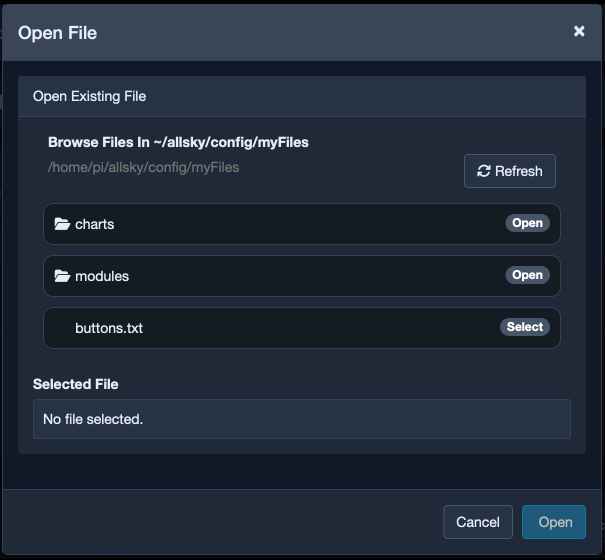
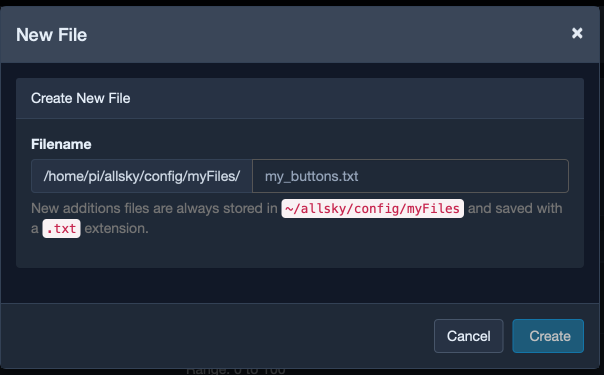
Opening or creating a System Page Additions file
Working With Files
The editor revolves around additions files because that is how the System page stores custom rows and buttons. Each file contains one or more entries, and the editor presents those entries as a list you can review and manage.
When you open a file, the editor shows:
- the current file name,
- the entries already stored in that file,
- the type of each entry,
- a summary of what each entry contains,
- actions for editing, deleting, or testing relevant items.
This layout is useful because it gives you a clear overview before you change anything. You can see whether a file already contains the entries you need, whether something has been added before, and whether a button entry is likely to run the script you expect.
If a file is new and empty, the editor simply gives you a blank starting point. From there, you add the first row yourself.
The Three Kinds Of Additions
The editor supports the same three broad kinds of System page additions that the underlying additions files support, but it presents them in a more approachable form.
Data entries
Use a data entry when you want to show a straightforward label and value.
This is the simplest type of custom addition. It is suitable for information such as:
- ambient temperature,
- weather condition text,
- the current operating mode of an attached device,
- a plain status line produced by a script.
You normally provide a label, a displayed value, and an optional timeout. The timeout controls how long the data is considered current. If the data gets too old, the System page can mark it as expired so you do not mistake stale information for live information.
Progress entries
Use a progress entry when the value has a meaningful range and you want the System page to show it visually as a bar.
This type is useful for values such as:
- humidity,
- battery or power levels,
- fan speeds,
- temperatures with warning thresholds,
- any reading that is easier to interpret as a scale than as plain text.
In addition to the label and displayed value, you provide the minimum, current, and maximum values, along with warning and danger thresholds. The practical benefit is that the System page can do more than show a number. It can help you see whether that number looks healthy at a glance.
Button entries
Use a button entry when you want the System page to perform an action.
This is the most interactive type of addition. A button can be used to:
- run a maintenance script,
- toggle a dew heater,
- trigger a local action,
- call a helper script that updates or resets something on the Pi.
For a button entry, you typically choose:
- the button label,
- the command or script to run,
- an optional success message,
- a button colour,
- an optional Font Awesome icon.
The editor includes tools to help with these choices, including a browser for selecting a command file and an icon picker for choosing a button icon. That makes button creation much more approachable than editing the raw file by hand.
Editing An Entry
When you add a new entry or edit an existing one, the editor opens a form with fields appropriate to that entry type. This matters because it reduces guesswork. You are shown the fields that make sense for the kind of item you are creating, rather than one long confusing form covering every possible case.
For a simple data row, the form stays fairly short. For a progress bar, the form expands to include the range and threshold settings. For a button, the form focuses on the command, the label, the colour, the icon, and the success message.
This is exactly how a good end-user editor should feel. It helps you think in terms of what you want to achieve on the page rather than how the underlying file syntax works.
Testing Button Commands
One of the most useful features in the editor is the ability to test a button command before relying on it in normal use.
When you are working with a button entry, the editor provides a Test Script action. This is important because button entries are usually the most sensitive additions on the page. They do not just display information; they try to do something. If the command path is wrong, if permissions are missing, or if the script fails, you want to know that before you assume the button is ready for real use.
Testing from the editor helps you confirm:
- that the correct command is selected,
- that the script can be executed,
- that the script’s output looks sensible,
- that any error messages are clear and useful.
This does not remove the need for careful testing in the real environment, but it does make the first round of validation much easier.
Saving Changes
There are two distinct levels of saving in the editor, and it helps to understand the difference.
First, when you save an entry inside the dialog, you are saving that entry into the editor’s current working view of the additions file. In other words, you are updating the list of entries in the editor.
Second, when you choose Save File, you write those changes back to the actual additions file on disk. That is the step that makes the changes real for ongoing use.
This distinction is useful because it lets you make several edits before committing them to the file. You can add a row, adjust a progress bar, change a button label, review the results in the editor, and then save the whole file once you are happy with it.
Depending on your setup, you may also be asked whether the WebUI setting for System Page Additions should be updated to use the file you just saved. From a user point of view, that is simply the system checking whether the file you edited is the one the System page is actually configured to use. If it is not, the WebUI gives you the option of switching to the newly saved file.
What You Will See On The System Page
Once your additions file is saved and configured, its entries appear on the System page alongside the built-in information.
In practical terms:
- data entries appear as extra information rows,
- progress entries appear as extra progress bars,
- button entries appear as additional action buttons.
This means the System tab can gradually become tailored to your installation. A simple setup may only add one or two useful readings. A more advanced setup may turn the page into a full operational dashboard that includes environmental status, hardware controls, and custom monitoring information.
When The Editor Is Enough And When You Need More
For many users, the editor is enough on its own. If your needs are straightforward and the scripts you want to call already exist, the editor may be all you need to create and maintain your additions.
However, the editor is not a replacement for the underlying concept of additions files and data-producing scripts. The editor can help you build and maintain the file, but something still needs to generate the data that appears in custom rows and progress bars. In other words, the editor is the user-friendly front end for the feature, not the source of the data itself.
If you need to build more advanced additions, create new scripts, or understand the exact file structure in detail, refer to the dedicated how-to on System page additions. That guide goes deeper into how the data files work behind the scenes. The editor section here is intended to help you use the feature confidently from the WebUI, not to replace the more detailed setup guide.
Practical Advice For End Users
If you are new to the additions editor, a sensible approach is:
- Create or open one additions file.
- Add a single simple data row first.
- Save the file and confirm it appears on the System page.
- Add a progress bar only after you are comfortable with the basic workflow.
- Test button entries carefully before relying on them.
Starting small is usually the best approach. It gives you confidence in how the editor behaves and makes it easier to spot mistakes. Once you understand the flow of open, add, test, and save, the editor becomes a very practical part of day-to-day administration.
Summary
For most users, the System tab is the first and most important operational page in the Allsky WebUI. It combines status, control, and health information in one place and makes it easy to answer the practical questions that come up during normal use.
If you only remember one thing about this page, remember this: when Allsky seems wrong, start here. Very often the page will either show the problem directly or point you toward the next place to investigate.