Watchdogs
The Watchdogs tab is the part of the WebUI that helps you keep an eye on supervised background services. While the System page gives you a broad view of the Raspberry Pi and the Allsky installation as a whole, the Watchdogs page is more focused. It is concerned with specific services that Allsky expects to be present and with whether those services appear to be healthy right now.
This page is useful when you want to answer practical questions such as:
- Is a supervised service running?
- Has a service stopped unexpectedly?
- Does a service currently have a process ID?
- Is there an obvious recovery action available from the WebUI?
- Which service should I investigate next?
In other words, this page is not mainly about overall system health. It is about service-level supervision. If the System page tells you that something is wrong, the Watchdogs page often helps narrow that down to a smaller and more actionable question.
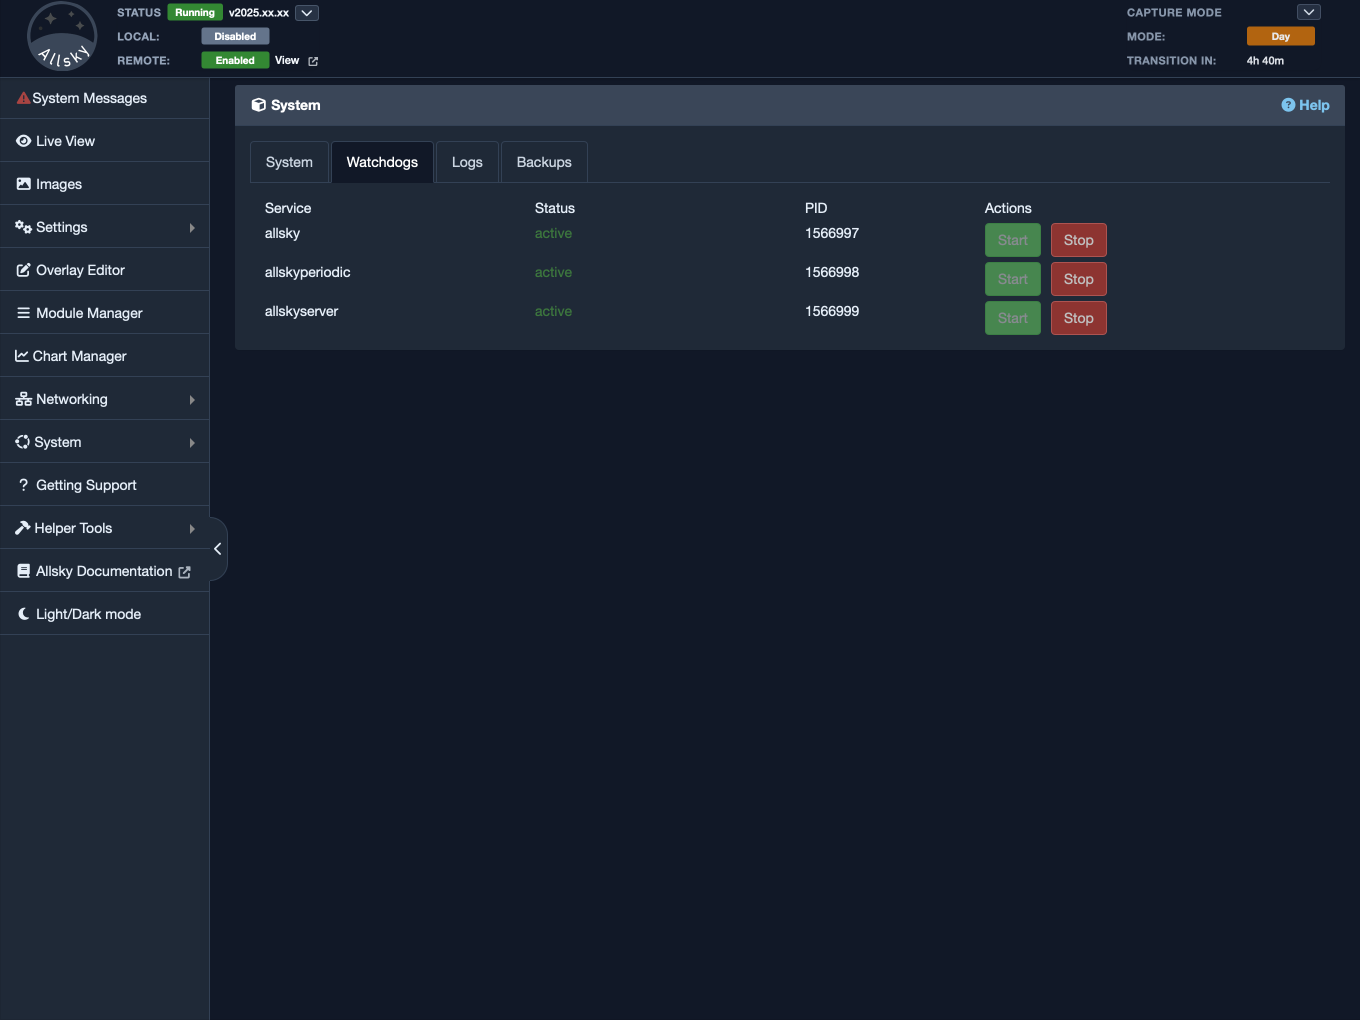
Watchdogs tab
Why This Page Matters
Many problems do not begin as full system failures. The Raspberry Pi may still be up, the network may still be working, and the WebUI may still open normally, but one background service may have stopped, restarted, or become unhealthy. When that happens, the overall system can look partly functional while still not behaving the way you expect.
That is where the Watchdogs page becomes useful. It helps you move from a vague concern such as “something is not working properly” to a more specific observation such as “this particular supervised service is stopped” or “this service is active but seems to have restarted”.
This matters because troubleshooting becomes much easier once the problem is more clearly defined. It is one thing to know that the system seems wrong. It is much more useful to know which supervised part of it looks wrong.
What The Page Shows
The Watchdogs page is usually presented as a simple table. Each row represents one supervised service, and each column gives you a different piece of operational information about that service.
Although the exact layout may vary slightly, the page generally shows:
- the service name,
- the current status,
- the PID,
- any available actions.
This simple layout is one of the page’s strengths. Service supervision is easiest to use when it is direct and immediately understandable. If something that should be running is not running, you want to see that straight away. You do not want to search through a complex interface just to find out whether a service is up.
The Watchdogs page is therefore designed less like a diagnostic laboratory and more like an operational checklist. It answers the most important first questions without forcing you to leave the browser or open a terminal.
Reading The Service Name Column
The service name tells you which supervised component each row refers to. For many users, this will be the first column they look at because it establishes what they are actually inspecting.
This is important because the page is not showing every process on the Raspberry Pi. It is showing the services that matter to Allsky’s watchdog view of the system. That makes the page much more focused than a generic process listing.
From an end-user point of view, that focus is useful. You do not need to mentally filter dozens or hundreds of unrelated processes. Instead, you are looking only at the services the WebUI considers relevant to operational supervision.
Understanding The Status Column
The status column is usually the most important part of the table. This is where you see whether a service appears to be active, stopped, or otherwise in a state that needs attention.
When everything is healthy, this column gives you reassurance that the supervised services are currently where they should be. When something is wrong, this is often the first place it becomes obvious.
The value of this column is not just technical. It is practical. A stopped service tells you something useful immediately:
- a feature may not be working,
- a background task may not be running,
- the next step may be to restart or inspect that service,
- the issue may not be with the whole Raspberry Pi, but with one service.
The status display is especially useful when compared with your real-world symptoms. If a feature in the WebUI is not behaving properly and the corresponding supervised service shows an unhealthy or inactive status, that is a strong clue about where to investigate next.
Understanding The PID Column
The PID, or process ID, may look like a small technical detail, but it is often more useful than it first appears.
A PID confirms that there is a current running process associated with that service. That matters because it distinguishes between a service that is merely expected to be running and one that actually has a live process at the moment.
For everyday users, the PID is helpful in a few practical ways:
- it confirms that the service really is running now,
- it can help you notice whether a service has restarted,
- it gives you a reference point if you later inspect logs or use command-line tools,
- it helps separate “active and stable” from “active but changing”.
For example, if the service still shows as active but the PID changes unexpectedly between checks, that may suggest the service has restarted. That does not always mean there is a problem, but it is a useful clue, especially when you are already investigating unusual behaviour.
Understanding The Actions Column
The actions column exists so that the page is not purely descriptive. It is meant to help you respond as well as observe.
Depending on the service and the way your system is configured, the page may provide one or more actions that let you interact with that service directly from the WebUI. The exact options can vary, but the idea is consistent: if a supervised service looks wrong, the Watchdogs page should help you take the next obvious step.
From a user point of view, this is convenient because it reduces context switching. Instead of noticing a problem in the browser and then immediately moving to the terminal, the page may already give you a practical recovery action.
That said, these controls should still be used thoughtfully. Restarting or otherwise intervening in a service may be appropriate, but it is still worth considering what symptom you are trying to fix and whether you need supporting evidence from the logs first.
How The Services Affect Each Other
One important detail to understand on this page is that the supervised services are not always independent of one another.
In normal use, the main Allsky process acts as the core of the running system. Because of that, stopping the Allsky process does not only stop that one row in the table. It also stops the related supervised services that depend on it. From an end-user point of view, this means that stopping Allsky is usually a wider action than it first appears. You are not simply pausing one component. You are effectively bringing down the rest of the supervised Allsky activity with it.
The relationship also works in the other direction. If one of the other supervised services is started from the Watchdogs page, Allsky itself will also be started. This is helpful because it means you do not have to manually work out the correct startup order for the dependent pieces. The system handles that relationship for you.
In practical terms, this means:
- stopping Allsky will also stop the other supervised Allsky services,
- starting one of the other supervised services will also start Allsky,
- actions on one row may therefore have wider effects than the row alone suggests.
This behaviour is worth remembering when you are troubleshooting. If you stop Allsky as part of a test, expect the other supervised services to stop as well. If you start a related service and then notice that Allsky is now running too, that is normal and expected rather than a separate surprise event.
Understanding that relationship makes the Watchdogs page much easier to interpret. It helps explain why several rows may change together after a single action and prevents you from mistaking normal dependency behaviour for an additional fault.
How To Use This Page In Practice
The best way to use the Watchdogs page is usually as a follow-up page rather than a starting page.
A common real-world flow looks like this:
- You notice that something in Allsky does not seem right.
- You open the System page to confirm whether the Pi and Allsky look broadly healthy.
- If the issue appears to be more specific than general, you open Watchdogs.
- You check which supervised service looks unhealthy, missing, or unexpected.
- You decide whether to use an available action or move on to Logs for deeper investigation.
This makes the Watchdogs page particularly useful when the system is only partly broken. If the whole Pi is down, this page is unlikely to help because the WebUI itself may be unreachable. But when the Pi is up and one feature seems wrong, Watchdogs is often exactly the right page to narrow the problem.
What This Page Is Not
It is important to understand what the Watchdogs page is not trying to be.
It is not a replacement for:
ps,top,htop,systemctl status,- detailed log analysis.
Those tools still have their place, especially when you are doing deeper technical troubleshooting. The Watchdogs page is more focused and more selective. It shows the supervised services that matter to the WebUI’s operational model rather than trying to expose every possible process detail on the Raspberry Pi.
That is not a limitation so much as a design choice. The page is intended to be immediately useful for operational checks, not to replace full Linux process inspection tools.
When To Move On To Logs
The Watchdogs page is very good at helping you answer the question “which service looks wrong?” It is much less effective at answering the question “why did it go wrong?”
That second question is usually where the Logs page becomes more important.
If the Watchdogs page shows a service that is stopped, unstable, or otherwise unexpected, the next step is often to open the relevant logs and look for:
- startup failures,
- permission errors,
- missing files,
- repeated restarts,
- timeouts,
- script or configuration errors.
Seen this way, the relationship between the pages becomes very clear:
- System tells you whether the installation looks broadly healthy.
- Watchdogs helps identify which supervised service looks wrong.
- Logs help you understand why it looks wrong.
That workflow is often the quickest route to a meaningful diagnosis.
Practical Reading Tips
When you look at the Watchdogs page, it helps to avoid reading it as a static inventory. Instead, treat it as a live operational snapshot.
Useful questions to ask yourself include:
- Does every service I expect to see appear in the table?
- Does the status of each service make sense right now?
- Is there a PID where I would expect one?
- Has the PID changed since the last time I checked?
- Is there an obvious action I should take here, or do I need logs first?
That way of reading the page makes it much more valuable. You are not just observing data. You are deciding whether the current service state matches what should be happening on the system.
Summary
The Watchdogs tab is the WebUI’s focused service-supervision page. It is most useful when the Raspberry Pi is still reachable and the system seems only partly wrong rather than completely unavailable.
Use it when you need to understand which supervised service looks unhealthy, stopped, or unexpected. Used together with the System and Logs pages, it helps turn a vague operational problem into a clearer and more actionable diagnosis.