Networking
Overview
The networking area of the WebUI brings together three related pages: Configure WiFi, LAN Dashboard, and WLAN Dashboard. These pages work together, but they are not all meant for the same task. In simple terms, one page helps you connect to a wireless network, while the other two help you understand the current state of your wired and wireless interfaces.
For most users, the networking section answers two broad questions:
- how do I connect the Pi to the network I want to use?
- once it is connected, what does the current connection look like?
That distinction is useful because connecting to a network and diagnosing a network are related, but they are not the same job. The Configure WiFi page is mainly for taking action. The LAN Dashboard and WLAN Dashboard pages are mainly for checking status and understanding what is already happening.
If you think of the networking area in that way, the structure makes more sense straight away. You use Configure WiFi when you want to connect, reconnect, or see what wireless networks are available nearby. You use the dashboard pages when you want to inspect the current interface in more detail, confirm that the connection looks sensible, or investigate a problem.
Configure WiFi
For many users, Configure WiFi is the page they will use most often. It is designed to make wireless setup much easier than editing network files by hand, particularly on a headless Allsky system or on a system installed somewhere awkward to access physically. Instead of remembering network names, typing commands, or checking scan results in the terminal, the page brings the most useful wireless tasks into one place in the WebUI.
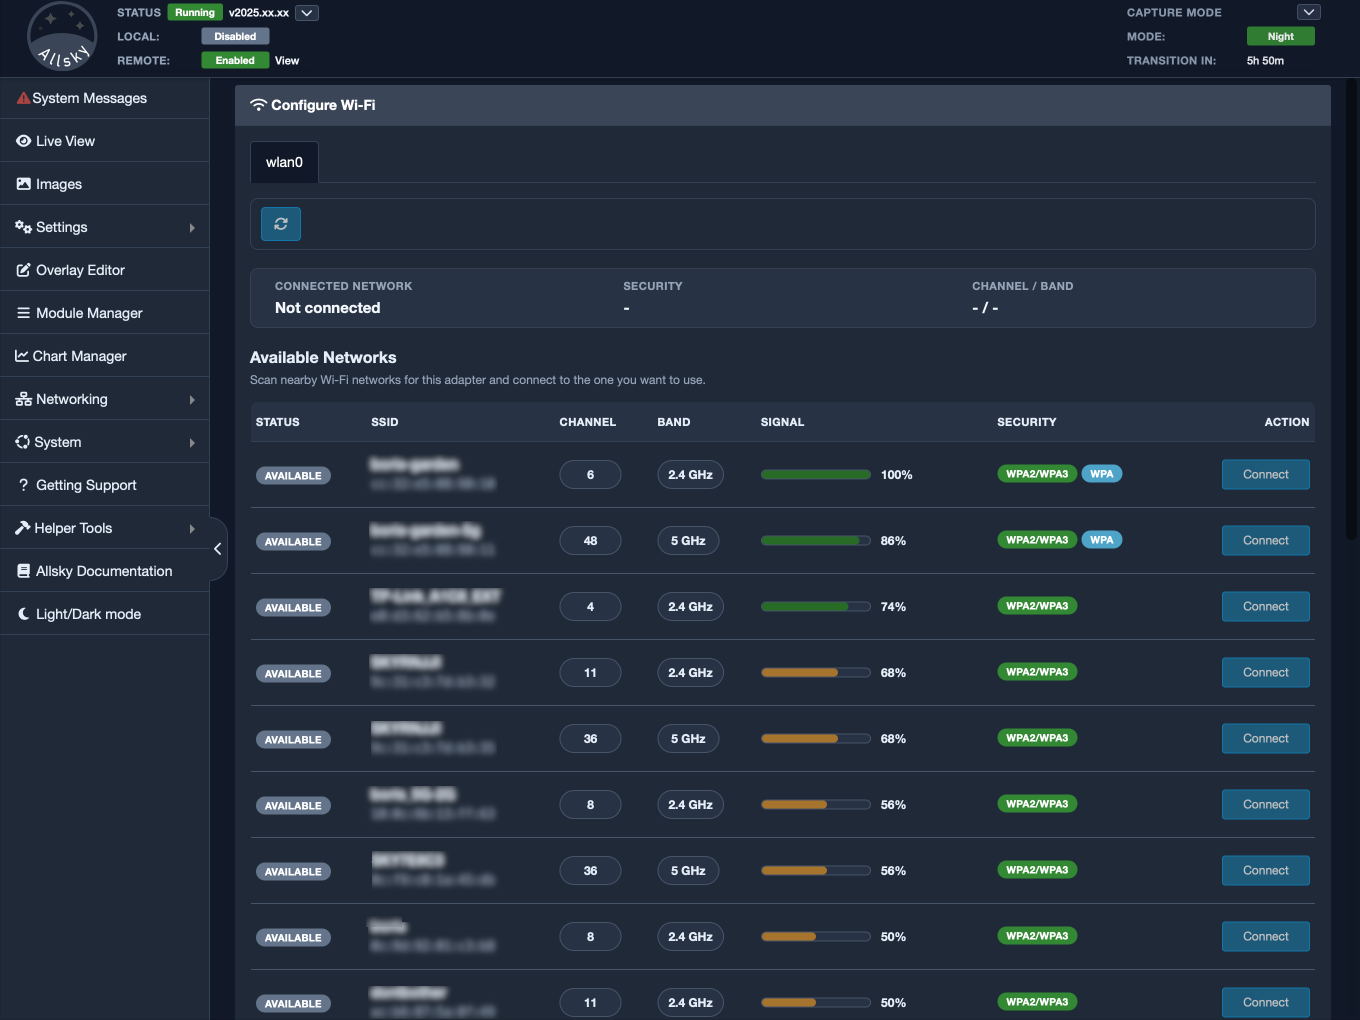
Placeholder: Configure WiFi main page
The page is organised by wireless adapter. If your system has more than one Wi-Fi interface, each one appears in its own tab. This is helpful because not every installation uses just a single built-in wireless device. Some systems have an additional USB Wi-Fi adapter, and some users may use one interface for their normal connection while keeping another available for testing, recovery, or a different network arrangement. Showing each adapter separately makes it much clearer which interface you are working with.
Within each adapter tab, the page begins with a summary of the current wireless state. This normally includes the network the adapter is connected to, along with related details such as the security type, band, and channel. That summary gives you a quick way to see whether the adapter is already connected and, if it is, whether it is connected to the network you expected. This can save time when troubleshooting because it tells you immediately whether the interface is associated with the right access point or whether it may already be using a different network.
Below that summary is the list of available wireless networks. This list is based on what the selected adapter can currently see. It is not a permanent list and it is not a record of all networks the Pi has ever known about. It is simply a view of the nearby wireless environment at the moment of the scan. That means the list can change depending on where the system is located, how strong the signal is, what obstacles are present, and whether the access point is currently reachable.
Because of that, the refresh button is important. It is not just reloading the page visually. It is asking the interface to scan again and update the list of visible networks. If you move the Pi, reposition an antenna, power up a router, or simply wait for the local radio conditions to change, the scan results may be different the next time you refresh.
Wireless scans are not always complete on the first try
A Wi-Fi scan is only a snapshot of what the adapter can see at that moment, and it is not always complete. A network may be temporarily missed, may only appear intermittently, or may take more than one scan to show up clearly, especially if the signal is weak or the wireless environment is busy.
If you expect to see a network and it does not appear immediately, do not assume straight away that the access point is down or that something is wrong with Allsky. In many cases, the right next step is simply to refresh the scan and check again.
This is especially common when the Pi is some distance from the router, when walls or obstructions weaken the signal, or when there are many nearby wireless networks competing for space on the same bands.
The network list is designed to show the details you are most likely to need when deciding which network to use. It includes information such as the SSID, whether the network is already in use, the channel, the band, signal strength, and the security type. These details matter because two visible networks may look similar at first glance but behave very differently in practice. One may be much stronger, one may use a different band, and one may require a different type of authentication.
That makes the page useful not just for connecting, but also for making a sensible decision about which wireless network is likely to be the best choice. In some installations, a slightly weaker network may still be the right one if it is more stable or better suited to the location of the Pi. In others, signal strength may be the deciding factor. The page does not make that choice for you, but it does give you the information you need.
When you choose to connect to a network, the page opens a connection dialog rather than switching immediately. This is helpful because it gives you a chance to confirm the adapter, network name, security type, channel, and band before proceeding. If the network is secured, the dialog also prompts you for the password.
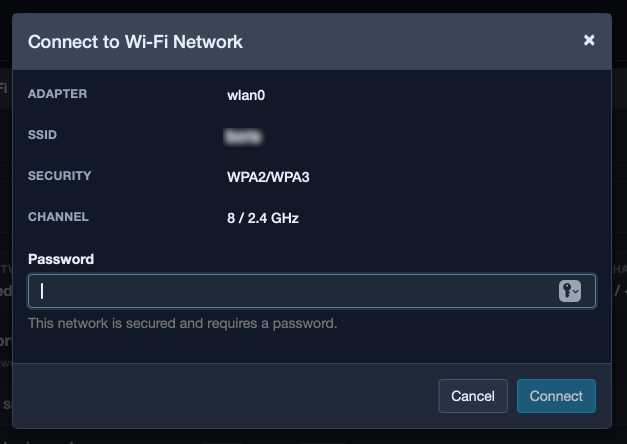
Configure WiFi connection dialog
That extra confirmation step is useful in everyday use because it reduces the chances of connecting to the wrong network by mistake. It is particularly valuable in places where there may be several similar SSIDs, guest networks, or multiple access points with comparable names.
The page also helps with one of the more frustrating wireless issues: a blocked radio. If Wi-Fi is blocked, the page tells you clearly instead of leaving you to wonder why no networks are appearing. A soft block usually means the radio has been disabled in software and can often be reversed with sudo rfkill unblock wifi. A hard block usually points to a lower-level restriction, such as a hardware switch, firmware setting, or another underlying system limitation. The difference matters because the likely fix is different in each case.
Another useful feature is that the page distinguishes between different kinds of failure. If no Wi-Fi adapters are found at all, that usually suggests a hardware, driver, or detection issue. If an adapter is present but no networks appear, that points more towards radio conditions, weak signal, or a blocked interface. These are very different situations, and treating them separately makes troubleshooting much easier.
In day-to-day use, Configure WiFi is best thought of as the practical action page. You come here when you want to see what wireless networks are available, connect to one of them, refresh the scan, or check quickly whether the adapter can see the network you expect. Once the connection has been made, the WLAN Dashboard is usually the better page for more detailed inspection.
WLAN Dashboard
The WLAN Dashboard is the page you use when the wireless interface is already present and you want to understand what it is doing. It is arranged per wireless interface and shows a much fuller picture of the current wireless connection. Depending on the system and interface, this may include details such as SSID, BSSID, bitrate, transmit power, signal level, link quality, frequency, band, channel, IPv4 and IPv6 addressing, gateway, DNS servers, MTU, and regulatory domain.
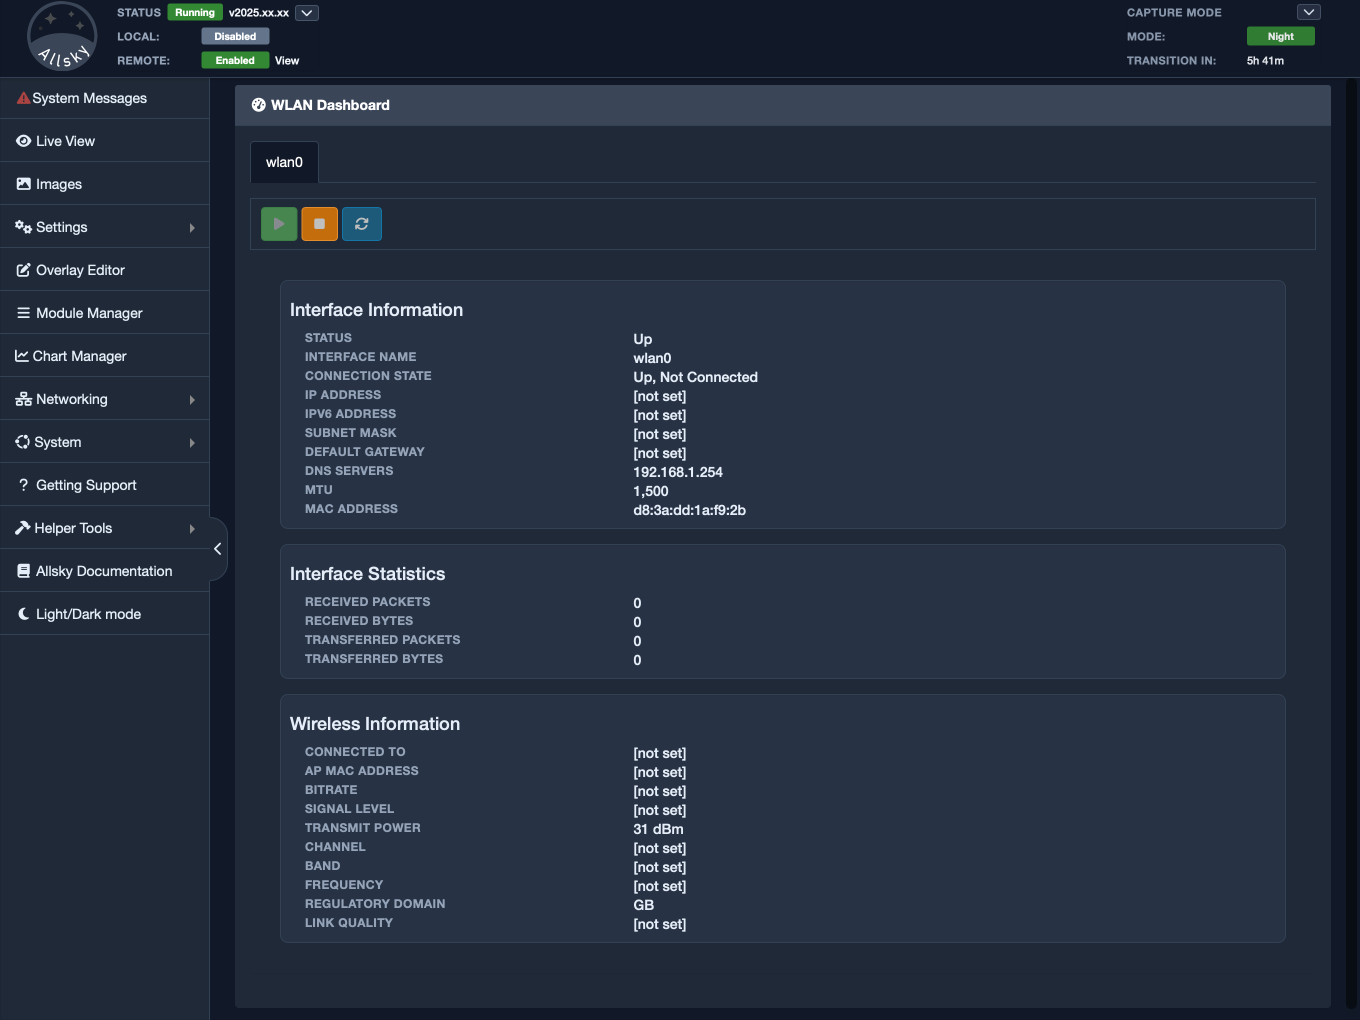
WLAN dashboard
In practical terms, this is the page to use when Wi-Fi is technically connected but not behaving as expected. For example, the connection may exist but feel slower than it should, drop intermittently, or be using a different band than you intended. The dashboard gives you the kind of detail that helps you understand what the wireless interface is actually doing at that moment.
This is also where the difference between being connected and being well connected becomes clear. A system may be associated with a network and still perform poorly if the signal is weak, the bitrate is low, or the interface is using an unexpected frequency or channel. The dashboard helps you move beyond a simple yes-or-no view of connectivity and see whether the connection looks healthy.
For many users, the most immediately useful items on this page are the network name, signal level, link quality, band, and bitrate. Together, these give you a rough picture of how strong and capable the connection appears to be. If you are also checking IP address, gateway, and DNS information, you can begin to tell whether the problem is with the wireless link itself or with the wider network configuration after the link has been established.
The WLAN dashboard is therefore best viewed as a status and diagnostic page. It is not mainly about choosing a network. It is about understanding the network you are already using.
LAN Dashboard
The LAN Dashboard performs a similar role for wired networking. Instead of focusing on Wi-Fi details, it shows the current state of Ethernet interfaces and the information needed to understand whether the wired connection is present, active, and behaving sensibly.
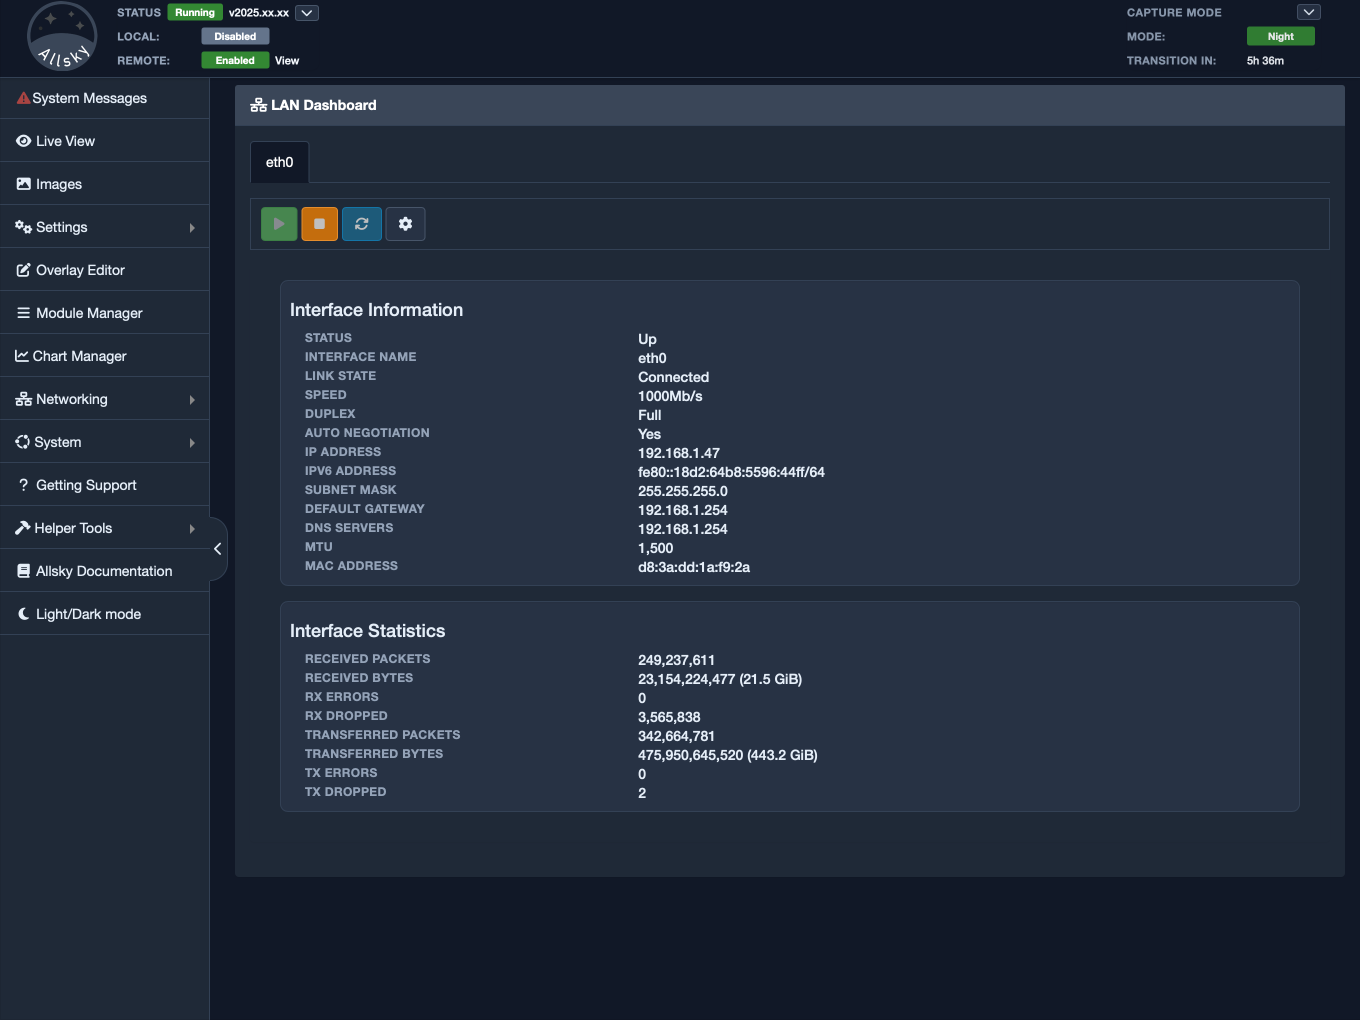
LAN dashboard
This page typically includes information such as link state, speed, duplex mode, auto-negotiation, IPv4 and IPv6 addressing, byte counts, packet counts, packet errors, packet drops, gateway, DNS, and MTU. In practical terms, this helps you answer a simple but important question: is the Ethernet interface merely connected physically, or is it actually up and working properly?
That distinction matters because a cable plugged into the Pi does not automatically mean the network is functioning correctly. The interface may be present but down, negotiated at an unexpected speed, or suffering from packet errors. The LAN dashboard gives you a clearer view of that situation than a simple “cable connected” assumption ever could.
This page is especially useful when the Pi appears to be connected by cable but the network still feels unreliable or does not behave as expected. Link state tells you whether the connection is genuinely up. Speed and duplex help confirm whether the connection negotiated in the way you expected. Packet errors and drops can suggest a cabling problem, switch issue, or another physical network fault. Gateway and DNS values help you see whether the broader network configuration looks sensible once the link itself is working.
For installations that use Ethernet as the primary connection, this may become the main networking status page. Even on systems that primarily rely on Wi-Fi, it can still be useful for checking a backup wired connection or for comparing how both interfaces are currently configured.
How The Pages Fit Together
Although these are three separate pages, they make the most sense when understood as one related part of the WebUI. Each page covers a different stage of working with networking:
- Configure WiFi is for choosing and connecting to wireless networks
- WLAN Dashboard is for inspecting the current wireless connection in detail
- LAN Dashboard is for inspecting the current wired connection in detail
In real use, you will often move between them. For example, you might use Configure WiFi to join a new network, then open WLAN Dashboard to confirm that the adapter connected on the expected band and has a reasonable signal level. If the system also has Ethernet connected, you might then look at LAN Dashboard to see whether the wired interface is active as well.
Thinking about the networking section in this sequence can be helpful:
- use Configure WiFi to make the connection you want
- use WLAN Dashboard or LAN Dashboard to confirm that the resulting connection looks healthy
- use the dashboard pages again later if you need to diagnose poor performance or unexpected behaviour
For most users, the simplest way to remember the difference is this: use Configure WiFi when you want to make something happen, and use the LAN or WLAN dashboard pages when you want to understand what is already happening. Taken together, these pages give you both the controls you need to connect the system and the information you need to understand the quality and state of that connection afterwards.