Logs
The Logs tab is where the WebUI moves from symptoms to evidence. Other pages can tell you that something looks wrong. The Logs page helps you see what the system actually reported when it happened.
This is one of the most useful pages in the WebUI when you are troubleshooting, because it gives you browser-based access to important log files without needing to open a terminal first. If Allsky failed to start, if a periodic task is misbehaving, if the web server has reported an error, or if a script is producing warnings, this is often the page that turns a vague problem into something concrete.
In practical terms, the Logs page helps answer questions such as:
- What happened when Allsky started?
- Did the web server report an error?
- Is a script failing repeatedly?
- Did a service log a warning just before something stopped working?
- What changed when I tested a setting or restarted a process?
That is what makes the page so useful. It does not just show status. It shows evidence.
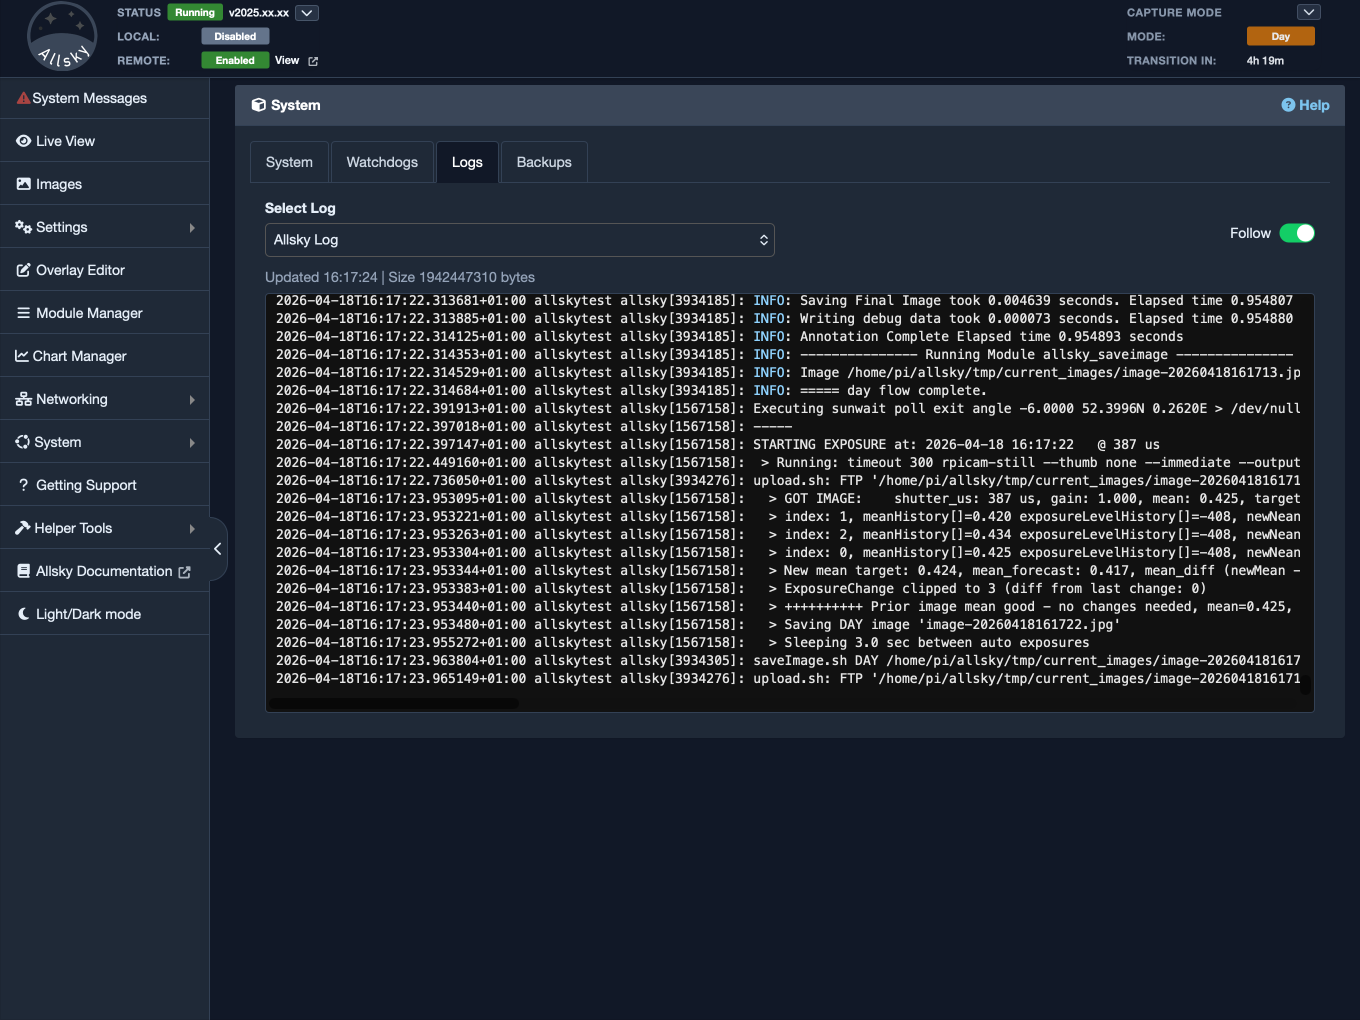
Logs tab main view
Why This Page Matters
Many problems cannot be understood from status indicators alone. A page may tell you that something failed, stopped, or did not update, but that still leaves the most important question unanswered: why?
The Logs page is often the first place you can answer that question properly.
Instead of showing summaries, it shows the messages written by the software itself. Those messages may include:
- normal informational output,
- warnings,
- errors,
- repeated failures,
- startup messages,
- web server problems,
- script output.
This matters because troubleshooting becomes far easier once you are no longer guessing. A symptom may suggest several possible causes. A log message often narrows that to one or two realistic ones very quickly.
What The Page Shows
The Logs page is built around two main parts:
- a selector for choosing which monitored log file to view,
- a large viewer area that displays the current contents of the selected log.
On many systems, the default list includes logs such as:
- the main Allsky log,
- the Allsky periodic log,
- the Lighttpd error log.
The exact list depends on how your system is configured, and it can be customised. That is important because the most useful log depends on the problem you are trying to solve. A capture issue, a scheduling issue, and a web-serving issue do not always show up in the same file.
The viewer itself is intended to be practical rather than decorative. It gives you enough space to scan recent log output and to spot what changed after a restart, a button press, or a configuration adjustment.
Choosing The Right Log
One of the main skills in using this page well is choosing the log file that best matches the problem you are seeing.
As a general rule:
- start with the Allsky log when the main capture or processing behaviour looks wrong,
- use the Allsky periodic log when the issue appears related to scheduled or repeated tasks,
- use the Lighttpd error log when the problem looks more like a WebUI or web-serving issue.
This is not a strict rule, but it is a useful starting point. If you open the wrong log first, the page may feel noisy and unhelpful. If you open the right one, the relevant messages often stand out much more quickly.
The Logs page is therefore most effective when approached with a question in mind. It works best when you are asking something specific such as:
- What happened when Allsky restarted?
- Why did this upload fail?
- Did the web server complain at the same time?
- What was written to the log when I pressed this button?
That is usually a better approach than opening the page and scrolling without any clear goal.
Reading The Log Viewer
The main viewer area shows the contents of the currently selected log. In normal use, you will often be looking at the most recent part of the file rather than its entire historical contents.
This is usually exactly what you want. During troubleshooting, the most valuable messages are often the recent ones:
- the lines written when a service started,
- the lines written just before a failure,
- the messages produced when you tested a change,
- the warnings that appeared when the system misbehaved.
The viewer is designed to make that recent activity easier to work with in the browser. It is not meant to replace a full terminal session for very large or long-term investigations. Instead, it is intended to get you to the important evidence quickly.
Using Follow Mode
One of the most useful controls on the Logs page is the Follow option.
When Follow is enabled, the viewer behaves more like a live tail command. As new lines are written to the selected log file, the page updates so you can watch the file change in near real time.
This is especially useful when you are actively testing something, for example:
- restarting Allsky,
- pressing a button in the WebUI,
- reproducing a problem,
- changing a setting and watching what gets logged,
- checking whether a repeated error continues to appear.
In these cases, Follow mode turns the page from a static viewer into a live troubleshooting tool.
Follow mode is particularly helpful because it lets you connect cause and effect more clearly. You take an action, and then you immediately see what the software wrote in response. That makes it much easier to understand whether the system accepted the action, ignored it, rejected it, or failed partway through.
Truncation And Resets
Log files can become large very quickly, especially on busy systems. For that reason, the WebUI does not try to behave like a full archive browser for arbitrarily large logs.
Instead, the page is designed to keep the browser view manageable. If the current display has been truncated, reset, or otherwise adjusted to keep the page responsive, the warning area on the page tells you that.
This is an important detail to understand. If you are viewing a busy log, you may be looking at the most recent section rather than every line ever written to the file. In practical troubleshooting, that is usually fine and often preferable. But it does mean you should not treat the WebUI viewer as the complete historical record of the file in all circumstances.
For deeper, longer, or more exhaustive inspection, a terminal-based view may still be more appropriate.
How To Use This Page In Practice
The Logs page works best when used as part of a larger troubleshooting flow.
A common pattern is:
- Notice a symptom in the system.
- Use the System page to confirm that something is wrong.
- Use Watchdogs if you need to identify which supervised service looks unhealthy.
- Open the Logs page to see what the software actually reported.
- Use Follow mode if you need to watch the effect of a restart, test, or repeated action.
This is one of the reasons the Logs page is so valuable. It fits naturally after the higher-level pages. The other pages tell you where to look. The Logs page often tells you what happened there.
Advanced: Customising Which Logs Are Shown
Most users do not need to change the list of logs shown in the WebUI, and the built-in defaults are usually the right place to start.
You should normally leave this alone unless you already have a clear reason to add a custom log, replace one of the built-in entries, or adapt the page for a more specialised installation. If you are simply trying to understand how to use the Logs page day to day, you can safely skip this section and return to it later only if your setup requires it.
The list of logs shown in the WebUI can be customised by creating a file called:
~/allsky/myFiles/monitorable_logs.json
If this file exists and contains valid JSON in the expected format, its entries are added to the built-in log list used by the Logs page.
In normal use, this means you can define extra logs without losing the standard ones that Allsky already provides. If one of your custom entries uses the same id as a built-in log, the custom entry takes precedence and replaces the built-in definition for that one log. This allows you to either add new logs or deliberately override a default one.
This is mainly useful when:
- you want the Logs page to show a different set of files,
- you want to remove logs you do not care about,
- you want to add logs from custom scripts or services,
- you want to make a different log the default selection.
For advanced users, this is a practical way to adapt the Logs page to a specific installation without changing the application code.
The JSON File Structure
If you do decide to use this feature, the JSON structure needs to be correct. The WebUI expects a specific format, and small mistakes in field names, paths, or JSON syntax can prevent the custom entries from working as intended.
The monitorable_logs.json file must contain a top-level JSON object with a logs array.
Each item in the logs array defines one log file that can appear in the Logs page.
The basic structure looks like this:
{
  "logs": [
    {
      "id": "allsky",
      "description": "Allsky Log",
      "location": "/var/log/allsky.log",
      "default": true
    },
    {
      "id": "lighttpd",
      "description": "Lighttpd Error Log",
      "location": "/var/log/lighttpd/error.log",
      "default": false
    }
  ]
}
Required fields
Each log entry should contain the following fields:
iddescriptionlocation
These fields are required for the entry to be accepted.
id
The id field is the internal identifier for the log.
It:
- must be unique within the file,
- must begin with a letter,
- may contain letters, numbers, underscores, and hyphens.
This field is mainly used internally by the WebUI, so it should be short and stable rather than descriptive prose.
Examples:
allskyallskyperiodiclighttpdmy_script_log
description
The description field is the user-facing label shown in the log selector on the Logs page.
This should be written in a way that makes sense to a human reading the WebUI. It is the name you will choose from in the browser, so clarity matters.
Examples:
Allsky LogAllsky Periodic LogLighttpd Error LogCustom Upload Script Log
location
The location field is the full absolute path to the log file on the Raspberry Pi.
This must be an absolute path beginning with /.
Examples:
/var/log/allsky.log/var/log/allskyperiodic.log/var/log/lighttpd/error.log/home/pi/myLogs/custom-script.log
If the file does not exist or is not readable by the WebUI, it will not be viewable successfully even if the JSON entry itself is valid.
default
The default field is optional and should be true or false.
If set to true, that log becomes the default selection in the Logs page. If more than one entry is marked as default, the first one encountered is used.
If you omit the field, it is treated as false.
This is useful when there is one log you usually want to see first whenever you open the page.
Example file
Here is a simple example showing how you might add one custom log alongside the standard built-in logs:
{
  "logs": [
    {
      "id": "uploader",
      "description": "Uploader Script Log",
      "location": "/home/pi/myLogs/uploader.log",
      "default": false
    }
  ]
}
This example adds a custom uploader log. Because the file is additive, the built-in logs remain available as well, even though they do not appear in this JSON file.
Practical advice
If you use ~/allsky/myFiles/monitorable_logs.json, it is worth keeping a few practical points in mind:
- the file must contain valid JSON,
- the top-level object must contain a
logsarray, - every log entry needs a valid
id,description, andlocation, - the file extends the default log list rather than replacing it,
- if a custom entry uses the same
idas a built-in entry, the custom one overrides that built-in entry, - the log files themselves still need to exist and be readable.
A good approach is to treat this as a controlled advanced change: start with a small, correct file and test it before adding more entries. If something looks wrong in the Logs page afterwards, the first things to check are the JSON syntax, the field names, and the filesystem paths.
Summary
The Logs page is one of the WebUI’s most important troubleshooting tools. It lets you inspect monitored log files directly in the browser, follow them live while testing, and move from symptoms to actual evidence much more quickly.
If you need to customise which logs appear in the page, create ~/allsky/myFiles/monitorable_logs.json and define the logs you want there. This is best treated as an advanced configuration step for installations with custom scripts, additional services, or a more specialised troubleshooting workflow.